TL;DR
var scaleFactor = 2;
for (var i = 0; i < num; i++) {
    var theta = 2.39998131 * i;
    var radius = scaleFactor * Math.sqrt(theta);
    var x = Math.cos(theta) * radius;
    var y = Math.sin(theta) * radius;
}
I needed to visualize some survey data where I could see proportions of categorical data as well as the actual number of respondents. While almost all data could be bar charts, this isn’t very exciting or pretty. The number of respondents was a manageable number (in the hundreds) so I could represent each one atomically. The next obvious thing would be to make a grid of squares, which is neat, but we can do better.

It would be fun to make a force layout in d3, which would get us individual nodes showing proportions, but all that movement amounts to chartjunk. I love me some verlet simulations, but less is more when trying to show data.
So basically what we want is a circle packing algorithm. All the nodes are the same size, since they represent a person. This will save us having to write a more complex algorithm to place each circle. I thought a great way lay this out would be something like a sunflower. So how would we accomplish this?
You might remember the Fibonacci sequence from elementary school. The ratio generated by one number in the sequence to the next approaches 1.6180339887…:1 or φ the Golden Section.
So how does this relate to our sunflower? Basically, the placement around the circle is a function of the Golden Angle. Basically, if we divide the circumference (2π) of the circle into two sections, the ratio of the length of the smaller to the larger is the golden section (φ). The arc length of the smaller section comes out to 136.508° or 2.39998131 radians. The radius at whatever point is the square root of the angle times an arbitrary scaling factor.
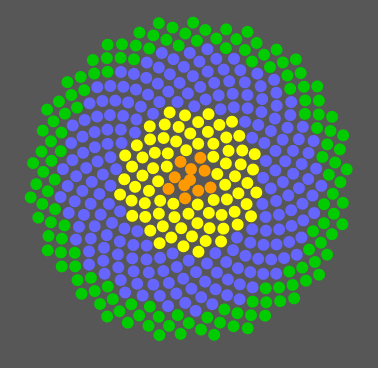
So if I wanted to place the dots for my visualization, I would iterate through a range of numbers, moving 136.508° around the spiral each step, gradually increasing my radius. I end up with something like this:

Changing the scale factor will make the dots more spread out.